
UI Elements
Line Chart
Show trends with straight or smooth curves and optional fill
Overview
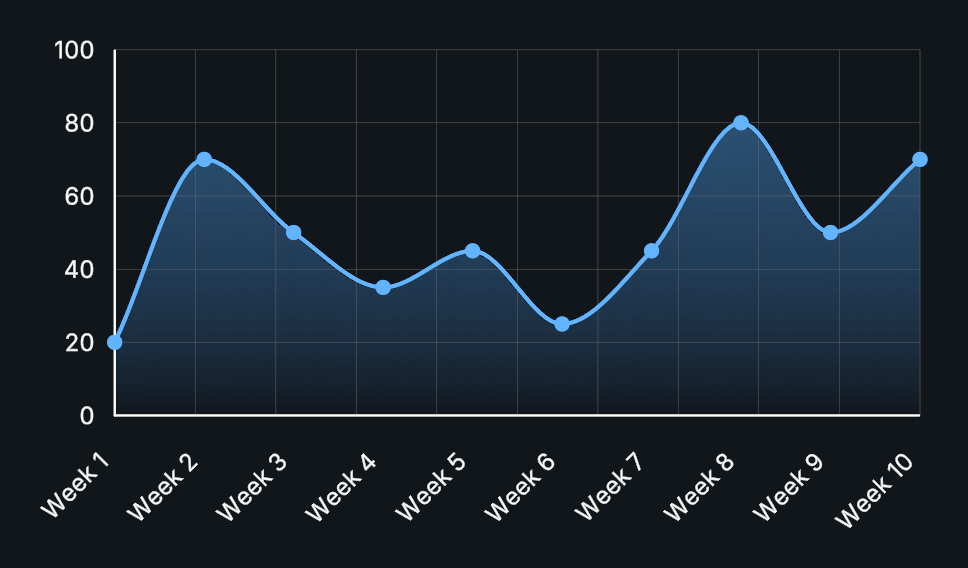
Line Chart plots a sequence of labeled values. V2 adds smooth curves, a filled area beneath the line, automatic value ranges, and more control over labels.
Usage
Create a Line Chart and add data points in display order.
Choose Straight or Smooth Curve Mode.
Enable Auto Scale, or provide a manual Value Range.
Choose whether the range should include zero.
Customization
- Enable Show Fill for an area chart and adjust the top and bottom fill opacity.
- Curve Subdivisions controls smooth-curve detail.
- Category and scale labels can be shown independently; use Label Rotation for crowded categories.
Public API
Use LineChart in the Evo.UI namespace.
Properties
Setting a property refreshes the chart. After editing dataPoints or a shape settings field directly, call DrawChart().
| Name | Type | Description |
|---|---|---|
AutoScale | bool | Uses the data range automatically. Disable to use Value Range. |
ValueRange | Vector2 | Minimum and maximum of the value axis while Auto Scale is disabled. |
IncludeZero | bool | Includes zero in the automatically calculated range. |
ScaleDivisions | int | Number of intervals on the numeric axis, from 1 to 50. |
LineThickness | float | Data line width in local UI units, from 0 to 20. |
Curve | CurveMode | Connects samples with straight lines or a smooth curve. |
CurveSubdivisions | int | Maximum subdivisions per smooth segment, from 2 to 32. |
ShowFill | bool | Displays the filled area under the line. |
FillOpacity | float | Fill alpha multiplier at the top of the plot, from 0 to 1. |
FillBottomOpacity | float | Fraction of the fill alpha kept at the bottom of the plot, from 0 to 1. |
ShowPoints | bool | Displays a marker at each data point. |
PointSize | float | Diameter of each data marker in local UI units, from 0 to 50. |
ShowGrid | bool | Shows grid lines. |
VerticalGridLines | int | Number of intervals across the horizontal axis, from 1 to 40. |
GridLineThickness | float | Grid line width in local UI units, from 0 to 20. |
ShowAxis | bool | Shows the axis lines. |
AxisThickness | float | Axis line width in local UI units, from 0.1 to 20. |
ShowCategoryLabels | bool | Shows category names. |
LabelFontSize | float | Category label font size. Labels may shrink to fit short columns. |
LabelPadding | float | Gap between category labels and the plot in local UI units. |
LabelRotationMode | LabelRotation | How bottom-axis labels turn when crowded. |
ShowScaleLabels | bool | Shows numeric labels along the value axis. |
ScaleFontSize | float | Numeric axis font size. Scale labels may shrink to fit the plot. |
ScalePadding | float | Gap between numeric scale labels and the plot in local UI units. |
ShowValues | bool | Shows numeric values beside bars or points. |
ValueFontSize | float | Data value font size. Values may shrink to fit the plot. |
ValuePadding | float | Gap between data values and their points in local UI units. |
DisplayFormat | NumberDisplayFormat | Numeric format used by value and scale labels. |
Fields
| Name | Type | Description |
|---|---|---|
dataPoints | List<DataPoint> | Ordered labeled values. |
Methods
| Name | Parameters | Description |
|---|---|---|
UpdateData() | List<DataPoint> newData | Replaces the data list. |
AddDataPoint() | string label, float value | Adds a labeled value. |
SetDataPoint() | int index, string label, float value | Changes an existing point. |
SetDataPoint() | DataPoint targetData, string label, float value | Changes an existing point. |
RemoveDataPoint() | int index | Removes a point by index. |
ClearData() | None | Clears data. |
SetPointSize() | float newSize | Changes marker size. |
DrawChart() | None | Refreshes geometry and labels. |
Example
using UnityEngine;
using Evo.UI;

public class LineChartExample : MonoBehaviour
{
    [SerializeField] private LineChart target;

    private void Start()
    {
        target.ClearData();
        target.Curve = LineChart.CurveMode.Smooth;
        target.ShowFill = true;
        target.LineThickness = 4f;
        target.AddDataPoint("Mon", 20f);
        target.AddDataPoint("Tue", 38f);
        target.AddDataPoint("Wed", 29f);

        // Call this when modifying the data entries directly
        target.DrawChart();
    }
}