
UI Elements
Pie Chart
Show proportions as a pie or donut with labels and a legend
Overview
Pie Chart divides a circle according to the relative values of its data points. A nonzero inner-radius ratio creates a donut chart.
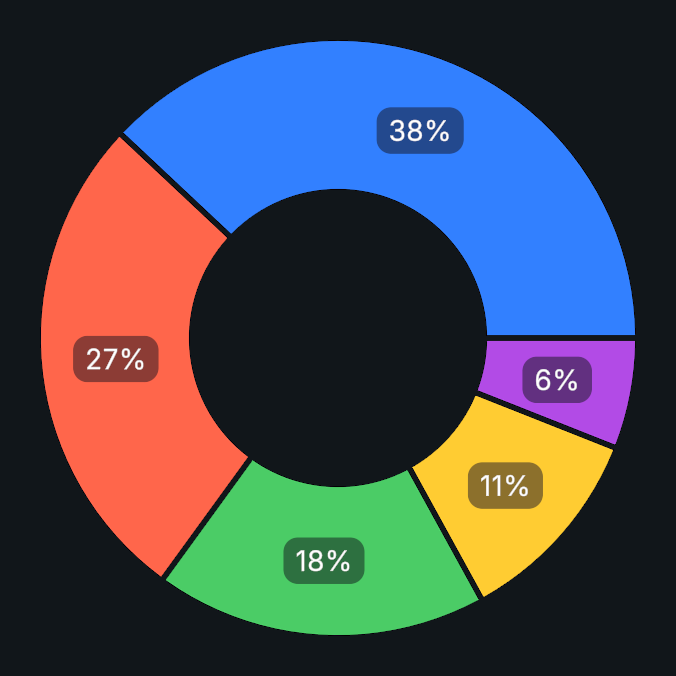
Usage
Create a Pie Chart and add labeled values with colors.
Choose pie or donut appearance with Inner Radius Ratio.
Enable labels, percentages, and the legend as needed.
Assign a legend container when displaying a separate legend.
Tips
- Minimum Label Percentage hides labels for very small slices, while Legend Values chooses percentage, value, both, or label-only display.
- Inner Radius Ratio sets the hole as a fraction of the outer radius: 0 makes a full pie and 0.6 leaves a ring around a hole that is 60% of the radius.
- Spacing under Style > Slices adds a gap between slices, in UI units. The gap keeps the same width from the center to the edge, so slices narrower than the gap disappear into it.
Public API
Use PieChart in the Evo.UI namespace.
Properties
Setting a property refreshes the chart. After editing dataPoints or a shape settings field directly, call DrawChart().
| Name | Type | Description |
|---|---|---|
InnerRadiusRatio | float | Hole radius as a fraction of the outer radius, from 0 to 0.95. Zero draws a solid pie. |
StartAngle | float | Angle of the first slice in degrees counterclockwise from the right. Wraps at 360. |
Segments | int | Minimum tessellation detail, from 3 to 512. |
PercentageDecimals | int | Decimal places in slice and legend percentages, from 0 to 4. |
SliceSpacing | float | Gap between adjacent slices in local UI units. The gap keeps the same width from the center outward. |
EdgeSmoothing | float | Smoothing width in screen pixels for the silhouette, outline and slice edges, from 0 to 3. |
DrawBorder | bool | Draws an outline along the inner and outer circumference. |
BorderWidth | float | Outline width in local UI units. Clamped to the available thickness. |
BorderAlignment | BorderPlacement | Places the outline inside, centered on, or outside the radii. |
ShowLabels | bool | Shows labels. |
ShowPercentages | bool | Shows percentages on slices. Disable to show formatted values. |
MinimumLabelPercentage | float | Hides labels below this percentage, from 0 to 100. |
LabelFontSize | float | Slice label font size. |
DrawLabelBackground | bool | Draws a procedural background behind each label. |
LabelPadding | Vector2 | Horizontal and vertical inset on each side of a label background, in local UI units. |
LabelCornerRadius | float | Uniform label background corner radius. |
ShowLegend | bool | Shows the legend in the assigned container. |
LegendContainer | RectTransform | Container for this chart's generated legend. |
LegendValues | LegendValueMode | Shows percentages, values, both, or category names only in the legend. |
HideZeroValueLegendItems | bool | Omits legend rows whose rendered value is zero. |
LegendFontSize | float | Font size used by legend labels. |
LegendItemHeight | float | Height of each legend row in local UI units. |
LegendColorBoxSize | float | Side length of each legend color swatch in local UI units. |
LegendCornerRadius | float | Uniform swatch corner radius, in pixels or percent according to Legend Shape radius mode. |
DisplayFormat | NumberDisplayFormat | Numeric format used by value and scale labels. |
Fields
| Name | Type | Description |
|---|---|---|
dataPoints | List<DataPoint> | Labeled slice values and colors. |
labelShape | ShapeSettings | Label background corner, softness and outline settings. |
legendShape | ShapeSettings | Legend swatch corner, softness and outline settings. |
Methods
| Name | Parameters | Description |
|---|---|---|
SetInnerRadiusRatio() | float ratio | Sets the donut ratio. |
UpdateData() | List<DataPoint> newData | Replaces all slice data. |
AddDataPoint() | string label, float value, Color color | Adds a label, value, and color. |
SetDataPoint() | int index, string label, float value, Color? color = null | Updates a slice, optionally changing its color. |
SetDataPoint() | DataPoint data, string label, float value, Color? color = null | Updates a slice, optionally changing its color. |
RemoveDataPoint() | int index | Removes a slice by index. |
ClearData() | None | Clears all slices. |
DrawChart() | None | Refreshes the chart. |
Example
using UnityEngine;
using Evo.UI;

public class PieChartExample : MonoBehaviour
{
    [SerializeField] private PieChart target;

    private void Start()
    {
        target.ClearData();
        target.InnerRadiusRatio = 0.6f;
        target.SliceSpacing = 4f;
        target.AddDataPoint("Used", 65f, Color.cyan);
        target.AddDataPoint("Free", 35f, Color.gray);

        // Call this when modifying the data entries directly
        target.DrawChart();
    }
}