
UI Elements
Radar Chart
Compare several attributes around a radial scale
Overview
Radar Chart places each attribute on its own axis and connects the values into a polygon. It is useful for profiles, ratings, and other sets of related measurements.
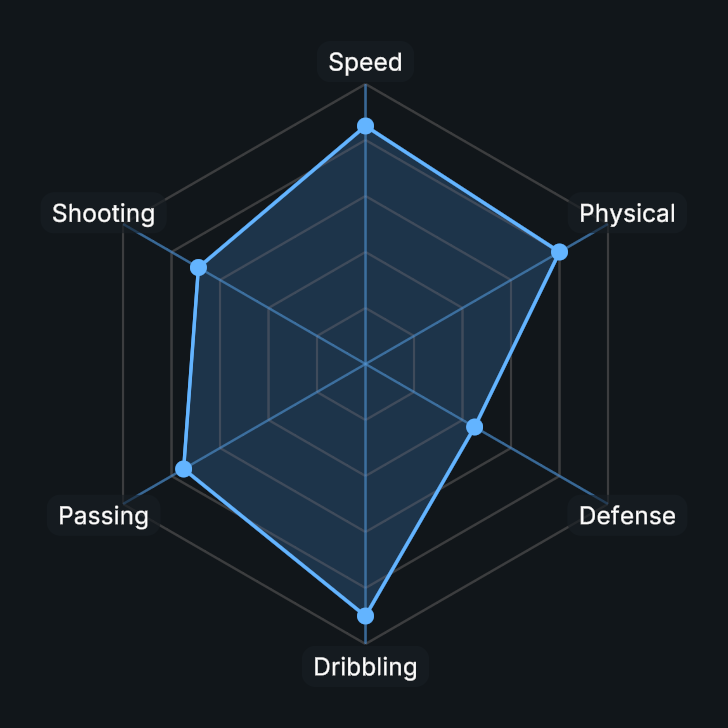
Usage
Create a Radar Chart and add at least three labeled attributes.
Set a common Maximum Value for the axes.
Choose which fill, line, point, grid, and label layers to display.
Public API
Use RadarChart in the Evo.UI namespace.
Properties
Setting a property refreshes the chart. After editing dataPoints or a shape settings field directly, call DrawChart().
| Name | Type | Description |
|---|---|---|
MaximumValue | float | Value represented by the outermost grid polygon. |
StartAngle | float | Angle of the first axis in degrees counterclockwise from the right. Wraps at 360. |
ShowLine | bool | Shows the line connecting the data points. |
LineThickness | float | Data line width in local UI units, from 0.1 to 20. |
ShowFill | bool | Shows the filled area. |
ShowPoints | bool | Shows a marker at each data point. |
PointSize | float | Diameter of each data marker in local UI units, from 0.1 to 50. |
ShowGrid | bool | Shows grid lines. |
GridLevels | int | Number of concentric grid polygons, from 1 to 30. |
GridLineThickness | float | Grid line width in local UI units, from 0 to 20. |
ShowAxis | bool | Displays the chart axes. |
AxisThickness | float | Axis line width in local UI units, from 0 to 40. |
ShowLabels | bool | Shows labels. |
LabelFontSize | float | Category label font size. |
LabelOffset | float | Distance beyond the plot radius for category labels in local UI units. |
ShowValues | bool | Displays each value under its label. Requires Show Labels. |
DrawLabelBackground | bool | Draws a procedural background behind each label. |
LabelPadding | Vector2 | Horizontal and vertical inset on each side of a label background, in local UI units. |
LabelCornerRadius | float | Uniform label background corner radius. |
DisplayFormat | NumberDisplayFormat | Numeric format used by value and scale labels. |
Fields
| Name | Type | Description |
|---|---|---|
dataPoints | List<DataPoint> | Attribute labels and values. |
labelShape | ShapeSettings | Label background corner, softness and outline settings. |
Methods
| Name | Parameters | Description |
|---|---|---|
AddDataPoint() | string label, float value | Adds a labeled value. |
AddDataPoint() | DataPoint point | Adds a DataPoint object. |
SetDataPoint() | int index, float value | Changes a value by index. |
SetDataPoint() | string label, float value | Changes a value by label. |
SetDataPoint() | DataPoint data, string label, float value | Changes the label and value of a data point. |
UpdateAllData() | float[] values | Replaces values in the current attribute order. |
RemoveDataPoint() | string label | Removes a data point by label. |
RemoveDataPoint() | int index | Removes a data point by index. |
RemoveDataPoint() | DataPoint point | Removes a data point by reference. |
ClearDataPoints() | None | Removes all attributes. |
DrawChart() | None | Refreshes the chart. |
Example
using UnityEngine;
using Evo.UI;

public class RadarChartExample : MonoBehaviour
{
    [SerializeField] private RadarChart target;

    private void Start()
    {
        target.ClearDataPoints();
        target.MaximumValue = 100f;
        target.AddDataPoint("Speed", 80f);
        target.AddDataPoint("Power", 65f);
        target.AddDataPoint("Control", 90f);

        // Call this when modifying the data entries directly
        target.DrawChart();
    }
}