
UI Elements
Vertical Chart
Compare categories with vertical bars
Overview
Vertical Chart compares numeric values across labeled categories. It uses the shared ChartBase styling and update workflow, with procedural bars and automatic range calculation.
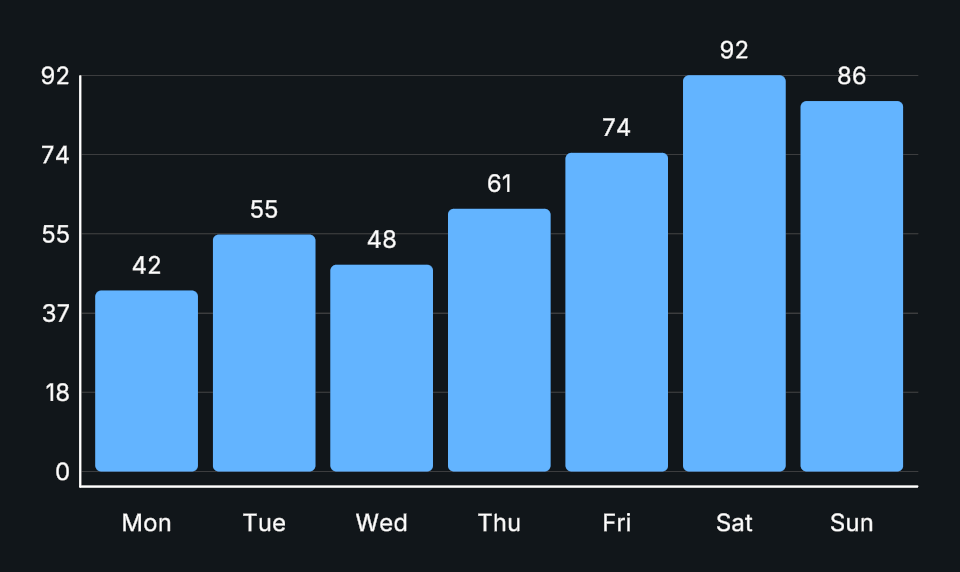
Usage
Create the chart and add labeled data points.
Leave Auto Scale enabled to derive the range from the data, or set Maximum Value manually.
Choose whether to show values, category labels, scale labels, grid, and axes.
Use the data methods for runtime changes.
Tips
- Scale Divisions controls the value grid.
- Label Rotation can be Auto, Horizontal, or Angled.
- Bar Shape controls procedural bar appearance; Use Data Colors lets individual points supply their colors.
Public API
Use VerticalChart in the Evo.UI namespace.
Properties
Setting a property refreshes the chart. After editing dataPoints or a shape settings field directly, call DrawChart().
| Name | Type | Description |
|---|---|---|
ScaleDivisions | int | Number of intervals on the numeric axis, from 1 to 50. |
AutoScale | bool | Scales bars to the largest value. Disable to use Maximum Value. |
MaximumValue | float | Value of the outermost grid line while Auto Scale is disabled. |
UseDataColors | bool | Uses each data point's color instead of the shared bar color. |
PlotPadding | float | Inset between the bars and the plot edges in local UI units. |
BarSpacing | float | Gap between adjacent bars in local UI units. Reduced when needed to fit the data. |
BarCornerRadius | float | Uniform bar corner radius, in pixels or percent according to Bar Shape radius mode. |
ShowGrid | bool | Shows grid lines. |
GridLineThickness | float | Grid line width in local UI units, from 0.1 to 20. |
ShowAxis | bool | Shows the axis lines. |
AxisThickness | float | Axis line width in local UI units, from 0.1 to 20. |
ShowCategoryLabels | bool | Shows category names. |
LabelFontSize | float | Category label font size. Labels may shrink to fit short rows. |
LabelPadding | float | Gap between category labels and the plot in local UI units. |
LabelRotationMode | LabelRotation | How bottom-axis labels turn when crowded. |
ShowScaleLabels | bool | Shows numeric labels along the value axis. |
ScaleFontSize | float | Numeric axis font size. Scale labels may shrink to fit the plot. |
ScalePadding | float | Gap between numeric scale labels and the plot in local UI units. |
ShowValues | bool | Shows numeric values beside bars or points. |
ValueFontSize | float | Data value font size. Values may shrink to fit the plot. |
ValuePadding | float | Gap between data values and their bars in local UI units. |
DisplayFormat | NumberDisplayFormat | Numeric format used by value and scale labels. |
Fields
| Name | Type | Description |
|---|---|---|
dataPoints | List<DataPoint> | Labeled values to draw. |
barShape | ShapeSettings | Bar corner, softness and outline settings. |
Methods
| Name | Parameters | Description |
|---|---|---|
UpdateData() | List<DataPoint> newData | Replaces all data. |
AddDataPoint() | string label, float value | Adds a labeled value. |
SetDataPoint() | int index, string label, float value | Updates a data point by index. |
SetDataPoint() | DataPoint item, string label, float value | Updates a data point by reference. |
RemoveDataPoint() | int index | Removes a point by index. |
ClearData() | None | Removes all data points. |
DrawChart() | None | Refreshes the chart from current data and settings. |
Example
using UnityEngine;
using Evo.UI;

public class VerticalChartExample : MonoBehaviour
{
    [SerializeField] private VerticalChart target;

    private void Start()
    {
        target.ClearData();
        target.AutoScale = true;
        target.BarSpacing = 12f;
        target.AddDataPoint("January", 45f);
        target.AddDataPoint("February", 70f);

        // Call this when modifying the data entries directly
        target.DrawChart();
    }
}